

The Physician’s Guide to Compensation: Understanding and Evaluating Compensation Incentives
Most physicians enter their first attending contract with years of clinical training but almost no context for how health system compensation models actually operate. The mechanics of physician pay and how day-to-day clinical work affects total earnings are rarely covered in medical school.
On top of that unfamiliarity, physicians often lack day-to-day visibility into how their production is being tracked and calculated behind the scenes. That disconnect usually surfaces after an extraordinarily demanding month, when the paycheck doesn’t seem to reflect the effort you expended. But what may seem like a calculation error is often the result of complex compensation rules operating in the background without accessible data to show the connection.
This guide traces how clinical work becomes a paycheck, what each component of a compensation plan measures, and how to gain clarity around your own numbers, empowering you to evaluate your earnings and make informed decisions about your practice.
The role of productivity in physician compensation
Health system compensation plans rely on standardized metrics to evaluate physician workload. These models establish the framework for how clinical activity is quantified, setting the baseline for how productivity is compensated.
The gap between clinical effort and physician pay
The most disorienting moment for physicians entering practice is the realization that a significant portion of their daily clinical effort simply does not translate directly into their compensation.
Consider spending 20 minutes on an appeal fighting an insurer’s denial for a patient’s medication, or standing by in the OR for a potential surgical intervention that ultimately isn’t needed. Both demand time, yet much of that work produces no CPT code, which means it generates no wRVUs.
In a production-based compensation model, work that does not generate documented CPT codes is not captured in wRVU totals, not because it wasn’t valuable, but because standard coding frameworks do not assign unit value to every non-encounter task. While quality bonuses and value-based incentives are designed to capture some of this extra effort, core productivity pay remains strictly tied to coded clinical output.
Training environments naturally emphasize thoroughness without highlighting how clinical documentation translates into production metrics. When you step into attending practice, navigating the reality of documented versus undocumented effort can feel like trying to play by a completely different set of rules.
How productivity-based models measure clinical output
Productivity-based pay reflects the volume and complexity of care delivered across a medical group. Standardized compensation models rely on work units to evaluate physician output across diverse specialties, establishing an objective framework that scales compensation directly with documented clinical activity.
The wRVU connects physician work to compensation. When a physician performs and documents a service, the associated CPT code may carry an assigned wRVU reflecting the required time, technical skill, cognitive effort, and clinical judgment. Once that encounter is finalized and coded, the physician earns production credit against their compensation plan.
Understanding this structure changes how a compensation plan reads. The model isn’t designed to undercount clinical effort, but rather to credit work that fits within standardized national coding guidelines.
Learn more: wRVU vs. RVU: How Physician Work, Cost, and Compensation Intersect
What this means for how physicians evaluate their own work
Once the productivity-based logic is clear, it becomes easier to interpret a compensation statement. Rather than wondering whether a paycheck reflects your workload, you can start verifying that every documented encounter is accurately recorded and credited.
This perspective directs attention to the specific operations where errors occur: missing charges, attribution gaps, and encounters that remain unclosed in the EHR. Scrutinizing these workflows requires timely, unified data. Tracking production across separate reports or delayed portal updates makes it difficult to catch uncredited work. When you can access production metrics and pay data in the same view, it becomes far easier to follow how the work you document is compensated.
See how your work translates into pay.
The Simpliphy Mobile App brings earnings and production data into a single physician-facing view.
What goes into physician compensation
Instead of a single base salary or per-wRVU rate, most physician compensation plans involve several different layers meant to align with the market, incentivize patient volume, and reward quality performance. Understanding how these individual components fit together provides a clearer view into how your contract was formulated and how your earnings are structured.
Base salary
Base salary serves as the predictable financial foundation of your contract, providing steady income regardless of short-term volume fluctuations. In many employment models, base salary acts as a guaranteed floor rather than a total earnings ceiling, though how it functions depends entirely on your contract structure.
In some models, base pay operates as a straightforward fixed salary for a defined period, independent of productivity metrics. In others, baseline pay is tied to an expected production target, where producing above that threshold unlocks variable incentive pay, while producing below it may trigger reconciliation.
Productivity incentives
Physician productivity incentives are the variable layer of compensation tied directly to clinical output, designed to reward volume, coverage, or patient management above baseline expectations. While the specific metric depends on your specialty and practice setting, common production and workload metrics include:
| Incentive | What it measures | Most common in | How it aligns with clinical goals |
| wRVUs | The physician work value assigned to a coded service, reflecting time, technical skill, cognitive effort, and clinical judgment | Outpatient specialties, surgical subspecialties, and employed medical groups | Aligns compensation with physician productivity based on the volume and complexity of clinical services performed. |
| Shifts and coverage hours | The total number of shifts or coverage hours completed, regardless of the volume or complexity of services coded | Emergency medicine, hospital medicine, and critical care | Ensures continuous facility coverage where patient census fluctuates unpredictably and undocumented triage is required. |
| Panel size | The total number of attributed patients under a physician’s active management | Primary care and capitated value-based arrangements | Incentivizes proactive population health management and care coordination rather than maximizing fee-for-service visit volume. |
These metrics directly shape your earning potential above base salary. Typically, an expected level of production is tied to your base pay, and reaching or exceeding that predetermined threshold unlocks variable incentive bonuses.
Some contracts layer multiple productivity incentives together—for example, combining a core wRVU volume threshold with a panel size multiplier or shift differential. Regardless of how these incentives are combined, health systems must ensure that total projected compensation across all productivity levers remains commercially reasonable and consistent with fair market value guidelines.
Value-based and quality components
While productivity incentives focus on clinical time and volume, value-based and quality components reward how care is delivered. According to MGMA’s 2025 provider compensation data, quality metrics now appear in over 38% of reported physician compensation models. Rather than scaling with unit output, these incentives represent a defined portion of compensation earned or forfeited based on performance against clinical quality, patient experience, or cost efficiency benchmarks.
Physicians most often encounter a mix of the following measures:
- Quality & preventive care metrics: Clinical benchmarks, such as HEDIS measures, that track preventive screenings, chronic disease management, and adherence to evidence-based treatment guidelines.
- Patient experience & satisfaction scores: Measures drawn from survey instruments like Press Ganey or Net Promoter Scores (NPS) that evaluate communication, care delivery, and overall patient perception.
- Clinical safety & event avoidance: Metrics tied to hospital-acquired conditions, readmission rates, or the avoidance of specific adverse “never events.”
- Total cost of care & shared savings: Population-level targets that reward physicians for reducing unnecessary utilization, improving care coordination, and keeping overall care costs within a predefined benchmark (most common in capitated or Medicare Advantage environments).
These components help bridge the gap between clinical effort and compensation, rewarding the extra time, thoroughness, and care coordination required for high-quality treatment that standard wRVU rates cannot capture.
Call pay and administrative stipends
Call coverage and administrative or leadership roles generate compensation that sits outside the wRVU model. Call pay compensates physicians for availability during off-hours coverage, and the structure varies: some organizations pay a flat rate per call shift, while others fold this duty into the base salary and pay per encounter during call.
Administrative stipends cover physician time spent on leadership, committee work, medical director responsibilities, or other non-clinical roles. Because this time doesn’t generate clinical production, it’s compensated and tracked separately from clinical productivity data.
Market benchmarks
Compensation teams consult national survey data to inform compensation design, evaluate production targets, and guide fair market value (FMV) analysis. Using benchmark data helps health systems stay competitive in the market while providing a baseline framework to support compliance with Stark Law and Anti-Kickback Statutes.
Market benchmarks provide helpful context when evaluating a contract, but they are not an absolute measure of whether your pay is accurate. A benchmark percentile reflects a broad peer sample, and its relevance depends on how closely the comparison group mirrors your specific practice parameters:
- Specialty: wRVU production norms and per-unit rates vary significantly across specialties. Benchmarks are only meaningful when calculated against your specific specialty cohort.
- Geographic market: Regional cost-of-living differences and local physician demand shift market medians across different parts of the country.
- Clinical FTE normalization: Benchmark comparison groups reflect full-time norms, requiring proportional scaling for part-time or split schedules.
Benefits, bonuses, and non-salary components
Beyond direct cash compensation, non-salary elements form a major component of an overall offer. When evaluating a contract structure, looking at the complete financial package helps provide a clear line-of-sight into total compensation value.
| Component | What it covers | Key consideration |
| Signing bonus | One-time payment at hire | May include repayment clauses if you leave early |
| Relocation assistance | Moving and transition costs | Taxable; value varies significantly by market |
| CME allowance | Continuing medical education expenses | Typically $2,000–$5,000/year; confirm eligible expenses |
| Loan forgiveness | Student debt repayment support | Can represent upwards of $20,000–$50,000 in annual value |
| Health, dental, & vision | Insurance coverage for physician and family | Employer contribution level varies widely |
| Malpractice coverage | Tail coverage and policy type | Confirm whether tail coverage is provided by the employer upon departure |
| Retirement contributions | 401(k) match or pension | Review vesting schedules and match caps |
Specific items represent significant financial value. For instance, with median medical school debt sitting around $215,000, an employer contributing $30,000 annually toward loan forgiveness provides a direct financial benefit that won’t show up on a standard base salary line. Similarly, malpractice tail coverage eliminates a potential cost that can reach six figures if you’re responsible for it on departure.
How productivity-based compensation actually works
Understanding the components is the foundation, while understanding the mechanics is what makes the numbers actionable.
wRVU tiers and what crossing a threshold means in dollars
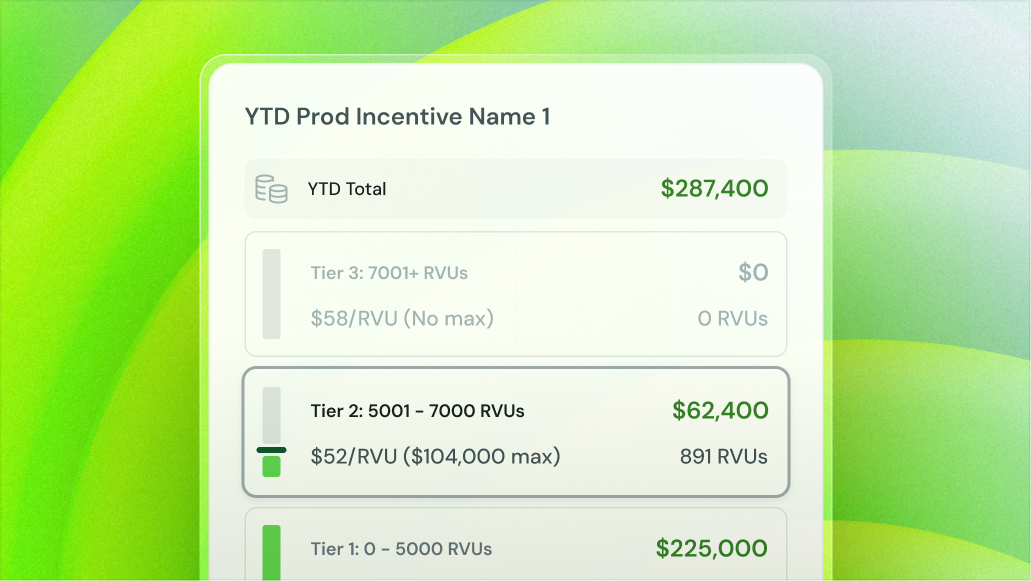
Many wRVU-based contracts are structured with a threshold: a base salary covers production up to a defined wRVU level, and a per-wRVU rate applies to production above it. In tiered contracts, crossing that threshold can unlock a higher rate on every unit above the line.
Here’s a simplified example: a base salary of $240,000 covers production up to 4,500 wRVUs. Above that threshold, the contract pays $55 per wRVU. A physician who produces 5,000 wRVUs earns $240,000 plus $27,500 for the 500 units above threshold. A physician who produces 5,500 wRVUs earns an additional $27,500 on top of that.
Knowing where you stand relative to your threshold mid-year gives you actionable insight. If you notice a 200 wRVU gap in September, you have time to evaluate whether picking up extra coverage or adjusting your patient capacity makes sense. Having real-time production data keeps those strategic options on the table.
That is where physician-facing visibility starts to matter operationally, not just conceptually. With the Simpliphy Mobile App, physicians can track production, earnings, and projected compensation in one place instead of waiting for a year-end surprise to show where they stood.
How FTE normalization affects your productivity expectation
A physician with a 0.75 clinical / 0.25 administrative FTE (full-time equivalent) split is not a full-time clinician, and should not be evaluated as one. The productivity expectation, the benchmark comparison, and the compensation threshold should all be scaled to the actual clinical fraction.
In practice, this means a physician at 0.75 clinical FTE should be benchmarked against 75% of the specialty median, not the full median. If the contract doesn’t reflect this scaling, the physician may appear underperforming against a benchmark that was never appropriate for their actual schedule.
This is rarely explained clearly in the contract itself. If your FTE is split between clinical and administrative responsibilities, confirm explicitly how your productivity target and benchmark are normalized.
Shifts and coverage as separate productivity levers
For shift-based physicians, coverage hours are tracked and compensated separately from any wRVU accumulation that may occur during those shifts. A hospitalist or emergency medicine physician may earn a base rate per shift and also accumulate wRVUs depending on how the contract is structured, or the model may be purely shift-based with no separate production component.
Call pay may layer on top of either model. Understanding how those elements interact, and which system tracks each one, helps identify where a discrepancy might originate if the numbers don’t reconcile.
Quality incentives layered on top of productivity
Quality bonuses are paid on a separate timeline and tracked through separate data sources than wRVU production. A physician might receive monthly or quarterly productivity payments and a separate annual quality payout based on HEDIS performance, patient satisfaction scores, or other defined metrics.
The financial weight of quality incentives varies by contract and employer, but they’re worth tracking. Quality scores are often finalized well after the performance period ends and pull data from different systems, including health plan records, patient surveys, EHR documentation, which can cause lags and accuracy issues.
Questions worth asking before and after you sign
Understanding your compensation model is a tool you’ll use throughout your career. Beyond initial contract review, having clarity around your numbers allows you to evaluate contract amendments, track progress toward incentive tiers, and make informed decisions about your workload.
How and when can I see my production and compensation data?
Asking about data visibility yields insight into both data currency and access methods. In many health systems, assessing your production data requires submitting a manual request to a compensation analyst or waiting for monthly or quarterly reports that often carry a significant time lag. When data is delayed by several weeks, the figures you review mid-year cannot reliably inform your current practice decisions.
In contrast, near-real-time access turns compensation data into a strategic tool for managing your workload. When you can see your current production pacing in real time, you gain the clarity needed to make informed choices, whether that means considering an additional coverage shift, expanding appointment availability, or adjusting your schedule relative to a bonus threshold or tier structure, if your plan includes those mechanics. Rather than realizing after a performance period closes that you were just a few wRVUs shy of an incentive target, real-time visibility keeps your options open while you still have time to act.
Tools like the Simpliphy Mobile App provide physicians with self-service access, bringing production tracking, earnings forecasting, and contract terms into a single view.
How does the organization track and measure my performance?
Your compensation calculation pulls from multiple systems. wRVU production typically flows from coded clinical activity in the EHR. Quality scores may come from health plan data, EHR documentation, or patient survey vendors. Scheduling and shift data may come from a separate system entirely.
Understanding which systems feed each calculation helps you identify where data lags or discrepancies originate. For example, an unclosed encounter in the EHR won’t transmit to your production report, leaving it uncounted in your wRVU total.
What is the process for reviewing a data discrepancy?
Clarifying the review process upfront normalizes data verification as a routine operational question rather than a confrontation. Most compensation operations have an established workflow for resolving data questions, even if it isn’t formally published in your contract.
Key details worth confirming include:
- Who is the right contact for wRVU questions versus quality score questions versus bonus calculations?
- What documentation do you need to provide to initiate a review?
- What is the typical turnaround time, and how far back can a correction be applied?
Establishing these pathways early ensures you have a clear, collaborative process to follow whenever a line item requires clarification.
What visibility changes
Physician compensation models are inherently complex because they balance multiple priorities: baseline income security, clinical productivity, population health goals, and patient access needs. The challenge for most physicians isn’t the complexity of compensation rules, but the lack of clear data showing how those rules are being applied to their daily work.
Understanding your contract and being able to verify your numbers are two different things. A physician can thoroughly understand their wRVU rate and threshold, yet still have no reliable way to know if clinical tracking is current, whether an encounter was misattributed, or how close they are to crossing an incentive tier with two months left in the year. That gap between contract terms and daily operational insight is where most compensation friction lives.
True visibility relies on accessible, timely data, including production metrics that update continuously, statements that clearly detail the underlying calculations, and a straightforward process for resolving data discrepancies. With these elements in place, compensation becomes a clear, manageable driver of your practice.
For a continuous view into how your work is compensated, the Simpliphy Mobile App provides on-demand visibility into production history, earnings, and forecasted compensation in a single mobile experience.

The Simpliphy Team combines experience in physician compensation, healthcare finance, operations, and technology to help health systems navigate one of their most complex administrative functions. Through practical insights and firsthand experience, our team shares perspectives that help organizations simplify compensation, improve transparency, and make more informed decisions.

Danny McNight is Director of Marketing at Simpliphy, leading the development of campaigns and brand experiences that make complex ideas clear and compelling. With a background in digital creative direction, he helps shape how Simpliphy communicates its value across channels and audiences.
The information in this article is for general informational purposes only and does not constitute legal, tax, financial, or compliance advice. Physician compensation arrangements, including fair market value determinations, are fact-specific and regulated under laws such as Stark and the Anti-Kickback Statute; consult a qualified attorney or valuation professional before relying on this information. This article reflects information current as of its publication date and may not account for subsequent changes in law, regulation, or industry practice.